Monitoring your Elasticsearch cluster is crucial for maintaining optimal performance and ensuring the health of your infrastructure. With our Elasticsearch Monitoring Setup Tool, you can easily deploy an Elasticsearch exporter in Docker, gather essential metrics, and visualize them using Grafana hosted by us! Follow the steps below to set up your monitoring instance and gain real-time insights into your cluster’s performance and health.
Table of Contents
How It Works
Our Elasticsearch Monitoring Setup Tool leverages Docker to streamline the deployment and operation of an Elasticsearch exporter. Here’s a brief overview of how it functions:
Deployment with Docker: You run a Docker container that hosts the Elasticsearch exporter. This exporter is configured with your Elasticsearch credentials and URL;
Data Collection: The exporter collects metrics data from the user’s Elasticsearch cluster;
Data Delivery: Using PushProx, the Docker container securely delivers the collected metrics data to our services;
We do not store/send any cluster credentials on our servers/services. All import metrics that are collected will be sent from your side.
Monitoring Instance Generation: Our services process the received data and generate a new monitoring instance;
Visualization with Grafana: The generated monitoring instance is accessible via a Grafana URL, allowing users to visualize and analyze the metrics in real-time.
This architecture ensures that the metrics data is efficiently and securely transmitted, providing users with valuable insights into their Elasticsearch cluster’s performance and health. You can check how data is exported by going to our github repository of this agent.
Installing Docker
Before deploying the agent, ensure Docker is installed on your system. Visit the Docker installation page for detailed instructions tailored to your operating system. Choose your OS—Windows, macOS, or Linux—and follow the provided steps to download and install Docker Desktop.
Setting Up Credentials for the Agent
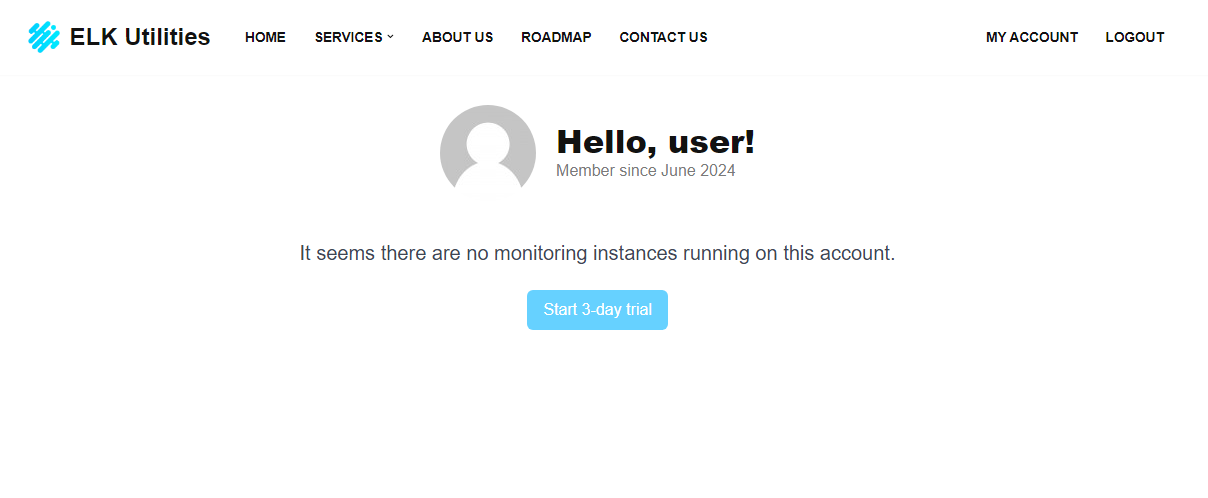
To begin your free trial, click on My Account, and once the page finishes loading, you can click in Start 3-day trial.
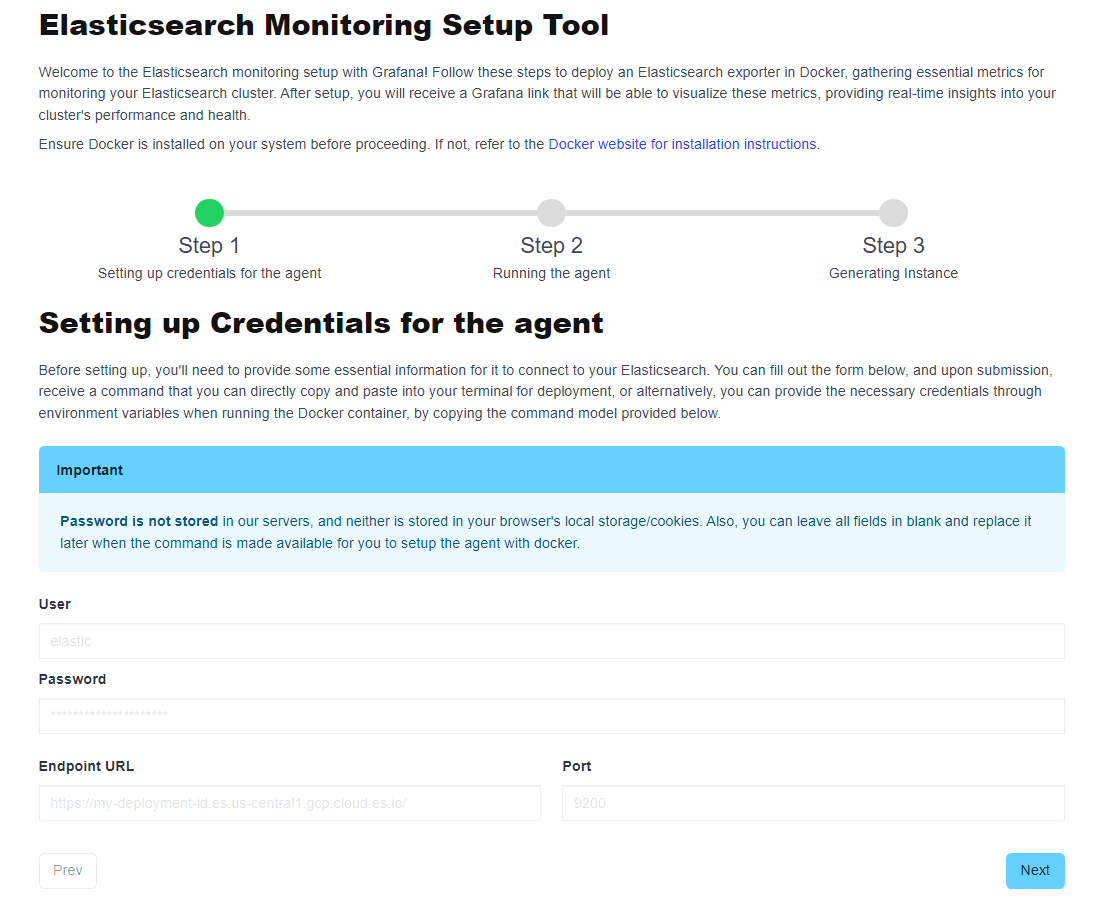
After pressing the button, the Elasticsearch Monitoring Setup Tool wizard will apear on your screen. Once there, you’ll begin to see a form on the page asking for credentials of your Elasticsearch cluster. This is only done so that the agent that is running from your side can collect the necessary metrics data and then deliver it to our services. If you want to, you may wish to leave the form in blank and set the enviroment variables later when running the docker image command.
Creating a New User for the agent
To monitor your cluster with our Instances, you can create a dedicated user for the agent. While you can use an existing admin user, it is strongly recommended to create a specific monitoring user for security purposes. This user will have the necessary roles to collect and transmit monitoring data without granting broader administrative access.
Create a Role
Use curl to define a new role (monitoring_role) with specific permissions, this command sets up a role with the necessary cluster and index-level permissions for monitoring operations. Replace elastic and password with your Elasticsearch superuser credentials, and http://your-elasticsearch-host:9200 with the actual URL of your Elasticsearch server.
curl -u elastic:password -X POST "http://your-elasticsearch-host:9200/_security/role/monitoring_role" -H "Content-Type: application/json" -d'
{
  "cluster": [
    "monitor",
    "read_ccr",
    "read_ilm",
    "manage_slm",
    "monitor_ml",
    "monitor_rollup"
  ],
  "indices": [
    {
      "names": ["*"],
      "privileges": [
        "monitor",
        "read_cross_cluster",
        "view_index_metadata"
      ],
      "field_security": {
        "grant": ["*"]
      }
    }
  ]
}'
Create the User
Next, create a new user with the previously defined role. Execute the curl command below, and remember to replace elastic and password with your Elasticsearch superuser credentials, and http://your-elasticsearch-host:9200 with the actual URL of your Elasticsearch server.
curl -u elastic:password -X POST "http://your-elasticsearch-host:9200/_security/user/monitoring-user" -H "Content-Type: application/json" -d'
{
  "password" : "user-password",
  "roles" : [ "monitoring_role" ],
  "full_name" : "Monitoring",
  "email" : "support@elkutils.com"
}'
Replace "user-password" with the desired password for the new user. This command creates a user named monitoring-user with the role monitoring_role, ensuring it has the necessary permissions to work with the Elastic exporter. Upon successful execution, you should receive a confirmation response as {"created":true}.
Now, your new user monitoring-user is set up with the appropriate permissions to use the Elastic exporter with Prometheus.
Running the Exporter
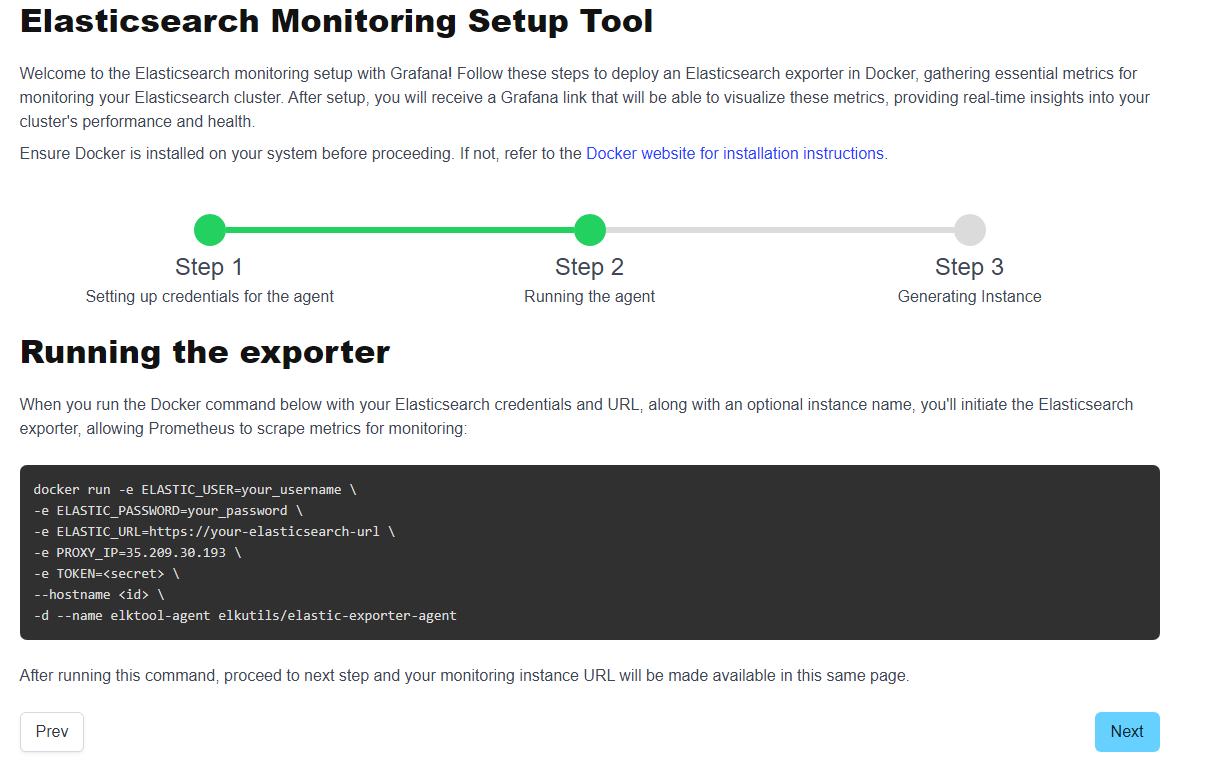
Once you’ve provided the necessary credentials, you can deploy the Elasticsearch exporter using the following Docker command with your credentials already included in the command. This sets up the exporter with your Elasticsearch credentials and URL, allowing Prometheus to scrape metrics for monitoring. For instance, below is an example of how your command will look like:
docker run -e ELASTIC_USER=your_username \
-e ELASTIC_PASSWORD=your_password \
-e ELASTIC_URL=https://your-elasticsearch-url \
-e PROXY_IP=35.209.30.193 \
-e TOKEN=<secret> \
--hostname <id> \
-d --name elktool-agent elkutils/elastic-exporter-agent
If you left the previous form in blank, then replace your_username, your_password, and https://your-elasticsearch-url with your actual Elasticsearch credentials and URL. After running this command, the exporter will initialize, and you’ll be able to proceed to the next step.
Generating the Monitoring Instance
Proceeding to the next step, you will be greeted with the following page:
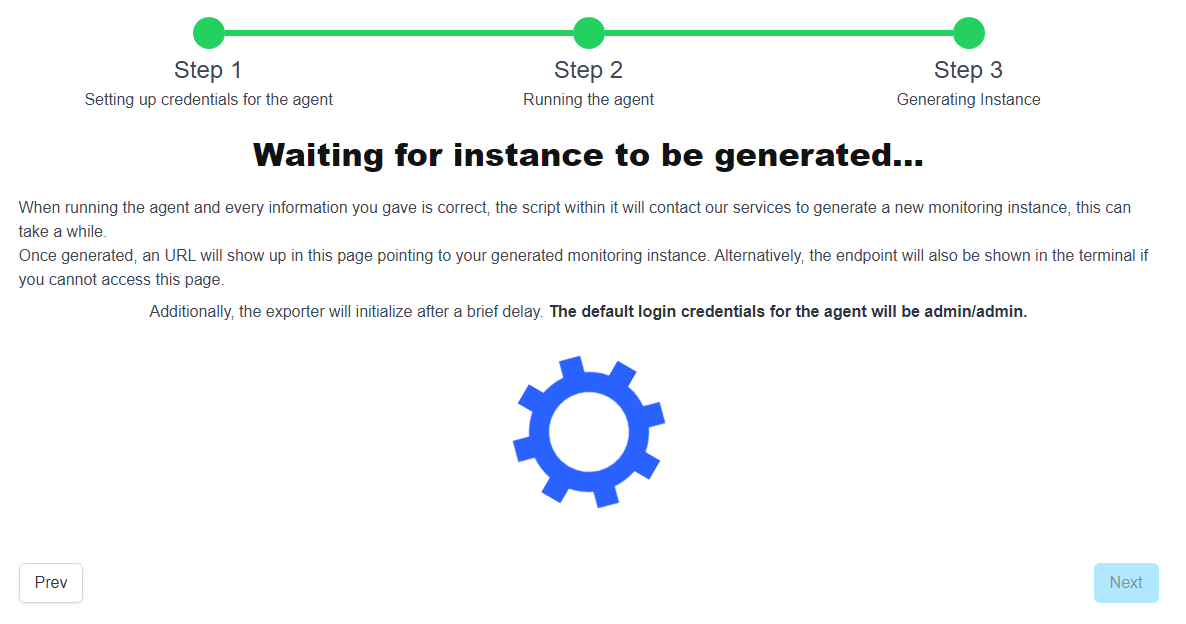
This page will constantly check if your instance is online or not, and once it detects it is, then it will show where your grafana instance is hosted. Keep in mind that it will only show up after you setup your agent locally. Once it’s setup, you will be able to connect to your grafana instance. Below is a picture on how it would look like if everything went smoothly:

Accessing Grafana
With the monitoring instance URL, you can now access Grafana to visualize the metrics collected by the Elasticsearch exporter. The default login credentials for Grafana are admin/admin. Once logged in, you can view your dashboards to monitor various aspects of your Elasticsearch cluster, including performance metrics, resource utilization, and potential issues. When accessing the URL that the website provides, you will be greeted with the following screen:
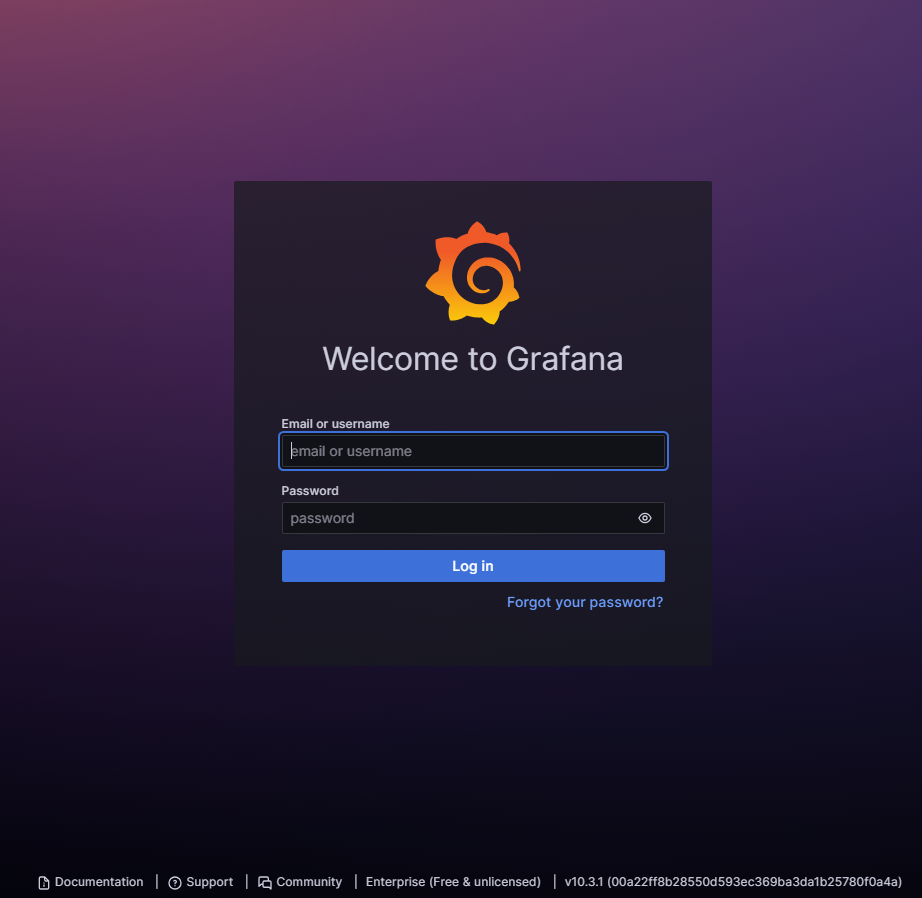
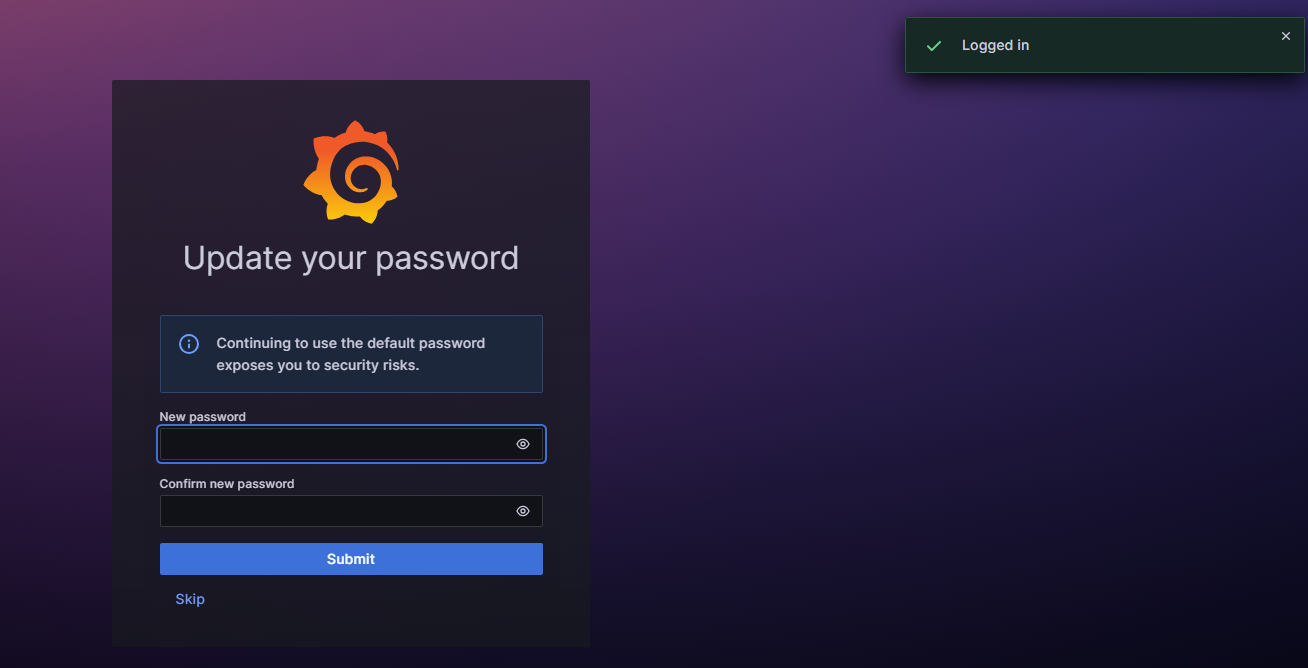
And you will insert the default credentials that we provide (admin/admin), and after login is successful, you will be offered to change the password of the admin account right out of the gate. We strongly recommend changing the password of your account, to prevent losing access to it.
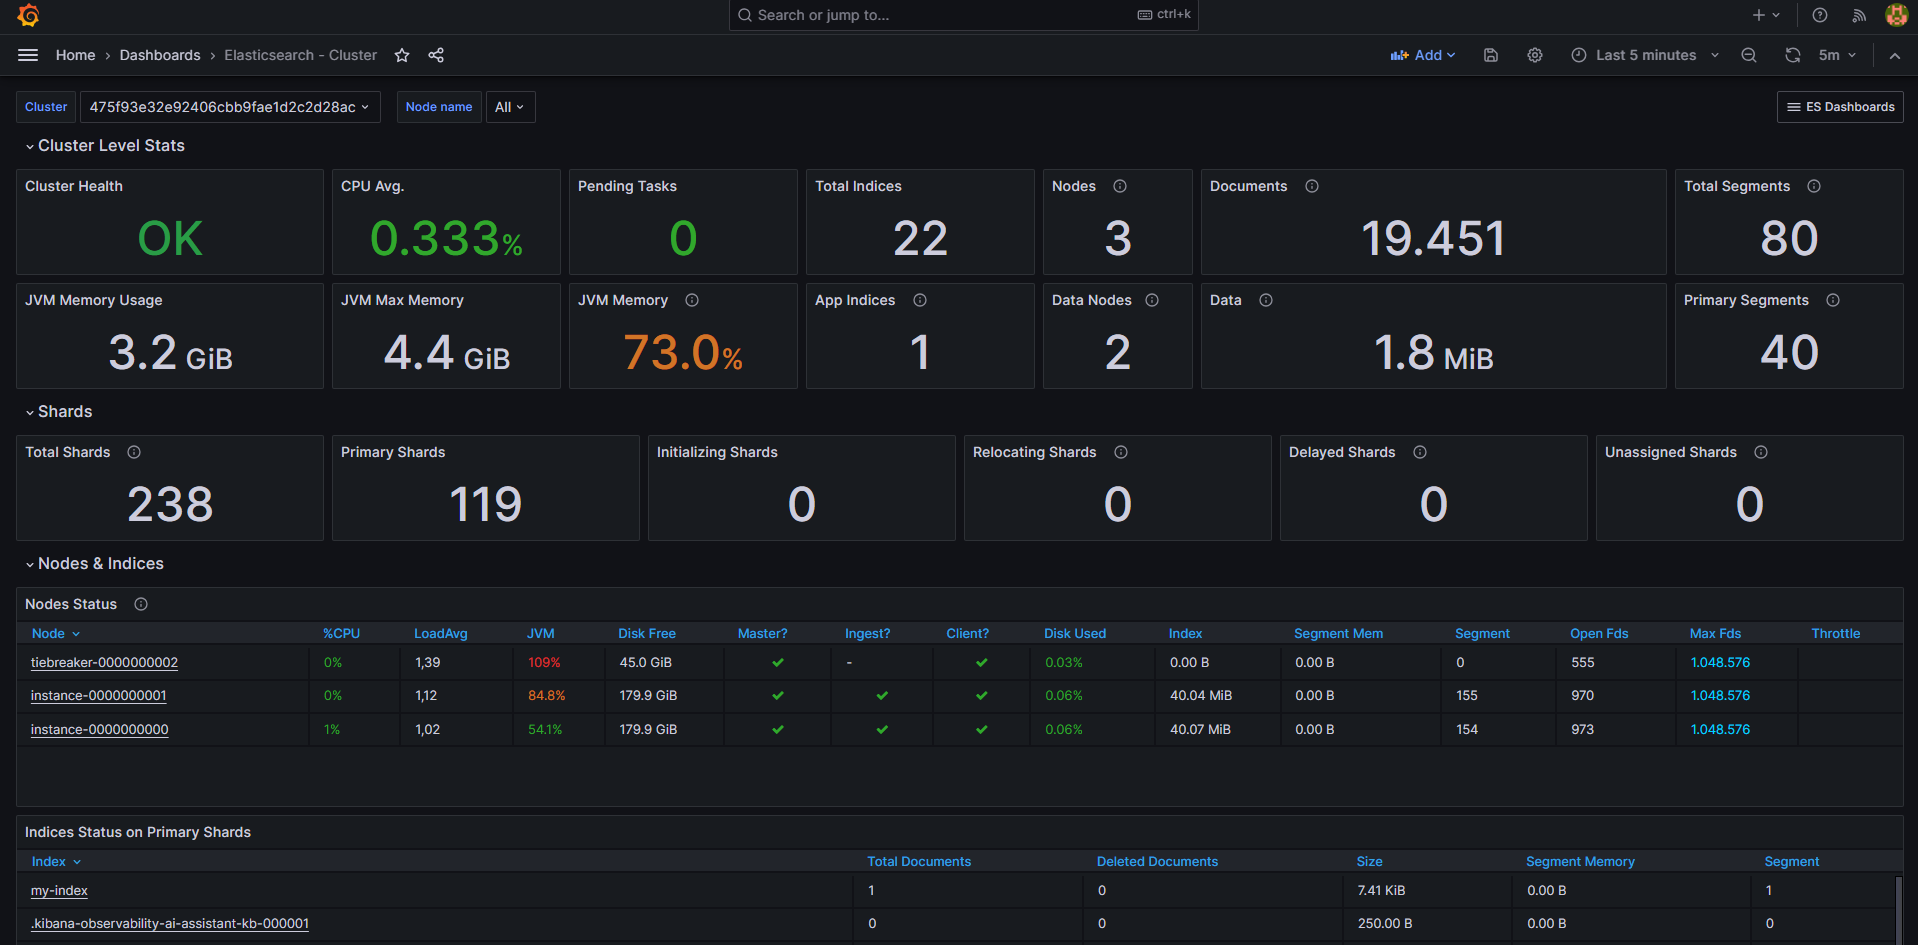
After that, if you maintain your agent running in the background, then congratulations, you’ve just created a new monitoring instance for your Elasticsearch cluster! Below, is an instance monitoring a newly created cluster from elastic.co:
Conclusion
Setting up a monitoring instance for your Elasticsearch cluster has never been easier. With the Elasticsearch Monitoring Setup Tool, you can quickly deploy an exporter, gather essential metrics, and visualize them using Grafana. This setup provides real-time insights into your cluster’s performance, helping you maintain optimal operations and proactively address any issues that arise.
Start monitoring your Elasticsearch cluster today and ensure its health and performance with our easy-to-use setup tool!